Flat vs. Cone: Basket Shape is as Important as Grind Size in Drip Brew Coffee - 25 Magazine, Issue 8

Fig. 1: An artistic rendering of a flat-bottom vs. semi-conical (“cone”) brew basket.
One of the most reliable ways of starting a passionate argument, at least in a room filled with coffee aficionados, is to ask a simple question: What is the best shape for a drip brew filter basket?
Postdoctoral fellow Dr. SCOTT FROST, Professor JEAN-XAVIER GUINARD, and Professor WILLIAM D. RISTENPART share early results of an ongoing research project in partnership with the SCA and Breville Corporation.
Anybody who has shopped around lately for a drip coffee brewer will recognize that modern brewers typically come with a filter basket that is either “semi-conical” or “flat bottom” (cf. Fig. 1). Fans of semi-conical baskets tend to eloquently describe the enhanced flow through the coffee grounds, the increased uniformity of extraction, and the correspondingly improved taste. Confusingly, fans of flat-bottom baskets will cite exactly the same benefits for flat bottom baskets. The evidence in favor of one opinion or the other has tended to involve anecdotal reports of individual taste tests.
What has been missing, to date, is hard data to answer the question scientifically and rigorously.
In 2017, the SCA asked the University of California Davis Coffee Center to perform research aimed at expanding and updating the classic brewing control chart for drip brew coffee. That research is in progress (with exciting preliminary results!), but as an initial “warm-up” project (and to settle our own passionate arguments) we decided to tackle the question of flat-bottom versus semi-conical filter baskets. We were fortunate to partner with Breville Corporation, who provided underwriting for the whole project and who supplied us with their Precision Home Brewers, which feature easily swappable flat-bottom and semi-conical baskets. The main idea was to carefully hold all other variables constant (roast level, water temperature, flow rate, etc.) and to assess the impact specifically of the basket geometry on the brewed coffee.
Designing the Experiment
Before you can answer the question “Which shape is better?” you first have to answer the question “Is there even a difference?” Despite the firm convictions of coffee aficionados, it’s entirely possible that there actually isn’t any perceptible or statistically significant difference. To determine whether there’s a difference, we first used “discrimination testing,” also known as “triangle tests.” In these tests, a panelist would be presented with three cups of coffee, two of which were identical and one of which was different. The panelist’s job was to identify which one was different. Since each panelist has a one out of three chance of getting it right just by luck, what you’re looking for is that much more than 33% of your panelists correctly identify the different cup. If they don’t, then there isn’t any significant difference.
We recruited 45 non-expert panelists to come taste the brewed coffees in the sensory descriptive isolation booths at the UC Davis Coffee Center. These booths, which are very different from a traditional cupping table, are designed to isolate the panelist to minimize context bias and to allow the coffees to be served in a truly blind fashion. The booths also feature red lights to minimize expectation bias based on how dark the coffee looks.
For our triangle tests, we used what’s known as a “2 by 2” factorial design, using both basket geometries and two different grind sizes (medium and medium-fine). This “factorial design” is a fancy way of saying that we performed six different triangle tests with all the possible combinations of basket geometry and grind size (Table 1). We also performed a seventh triangle with a light roast vs. a dark roast, an obvious taste difference that served as an internal calibration and control. The focus here was to determine the effect of brew basket shape and grind size.
One of the most challenging aspects of performing the experiments was nailing down the details of the coffee service, because the logistics of serving triangles of hot brewed coffee are non-trivial. For example, if two of the cups are hotter than the third, then the panelist is simply detecting a temperature difference, not a taste difference, so we had to work out procedures for serving differently brewed coffees all at precisely the same temperature. Likewise, we discovered that we had to normalize the “pour height,” since some of our assistants tended to pour the coffee higher than others; the resulting difference in the number of foam bubbles on top of the coffee could give away which was different just by visual inspection. We spent quite a bit of time working out details like these to ensure rigor.
Calculating the Results
The effort was worth it, though, because we obtained exciting – and counterintuitive – results, summarized in Table 1. Focusing on the first row, we see that when comparing the flat vs. cone basket shape, both using medium grind, we had 25 of our 45 panelists correctly identify the different cup. Importantly, we would expect one-third of our panel, 15 panelists, to get it right simply by luck, so the question became whether 25 getting it right is statistically significant or just a fluke. To answer this, we used what’s known as a “binomial probability distribution,” which is the type of probability that describes a series of coin tosses (but here for a “coin” that lands on heads just 33% of the time). Using this distribution, we were able to calculate the probability, or “p-value,” that 25 panelists got the right cup just by random luck. Here the p-value is 0.004, which means that if we repeated the experiment 1,000 times, we should expect to see 25 panelists get it right in only 4 of those 1,000 experiments. This is not very likely! In other words, it’s not a fluke, and there is a statistically significant perceptible difference between the two brews. We observe a similar result for flat vs. cone using the finer grind, with 23 out of 25 identifying the right cup (and a p-value of 0.024).
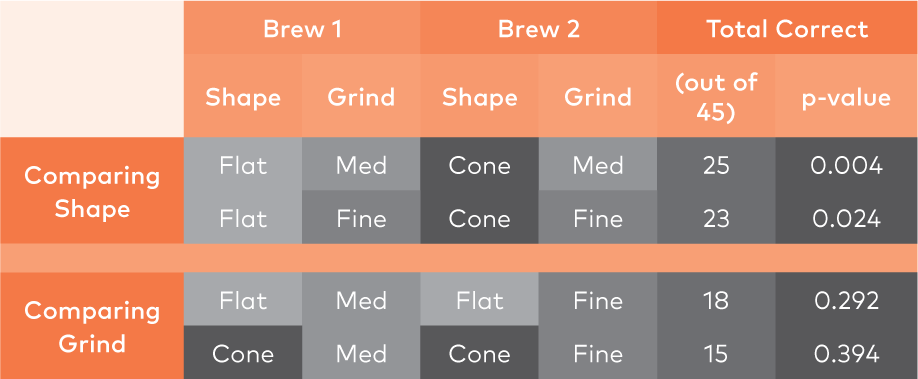
Table 1: Comparing brew bed shape and grind size.
So for all the coffee aficionados who argue that the basket geometry affects the taste – our data indicates that they are absolutely correct.
Surprisingly, however, our triangle tests also revealed that our non-expert panellists were not able to tell the difference in grind size. Rows 3 and 4 of Table 1 show the results for triangles brewed with the same geometry but different grind size. In the flat-bottom brewer, only 18 panelists chose the correct cup; in the conical brewer, only 15 did. This is no better than random. And we’re not talking about a minor difference: our “medium grind” had a median particle size of 1,065 microns, whereas our “medium-fine grind” had a median particle size of 799 microns, a 25% difference in size. For coffee aficionados who regularly extol the extreme importance of precisely controlling the grind size, it turns out that – for drip brew at least – regular people can’t tell the difference (at least over this range of grind size).
The triangle tests described above show that there is a perceptible difference, but they don’t say what the difference is. To address this question, we next performed a series of detailed “sensory descriptive” experiments. In this type of testing, we ask trained (expert) panelists to assess the intensity of various flavor attributes, such as “smoky,” “citrus,” “bitter,” etc. We invited our best-performing panelists (i.e., the ones who correctly identified triangle cups most often) to join our expert panel and we trained them on the WCR tasting lexicon with appropriate sensory references. We then had them assess 26 different flavor attributes, for 8 different sample types in a “2 x 2 x 2” factorial design: 2 basket shapes, 2 grind sizes, and 2 roast levels. Our expert panel blind-tasted each brew in our sensory descriptive isolation booths and provided numerical rankings of the 26 attributes.
With 12 expert panelists, each measuring 26 attributes, and 8 distinct samples repeated in triplicate, we obtained 12 × 26 × 8 × 3 = 7,488 individual data points. Needless to say, it’s challenging to represent such a large data set. A pictorial summary is provided in Fig. 2, which shows what’s known as a “principal components analysis” or PCA. This is an advanced statistical technique for taking large data sets and reducing them to the most meaningful “principal components” to help identify which populations are least or most similar.

Fig. 2: The resulting Principal Component Analysis (PCA) plots. The top plot groups the most similar statistical results together. From this, it’s possible to see that the biggest difference is between the light and the dark roast, but also that basket shape yields a meaningful difference.
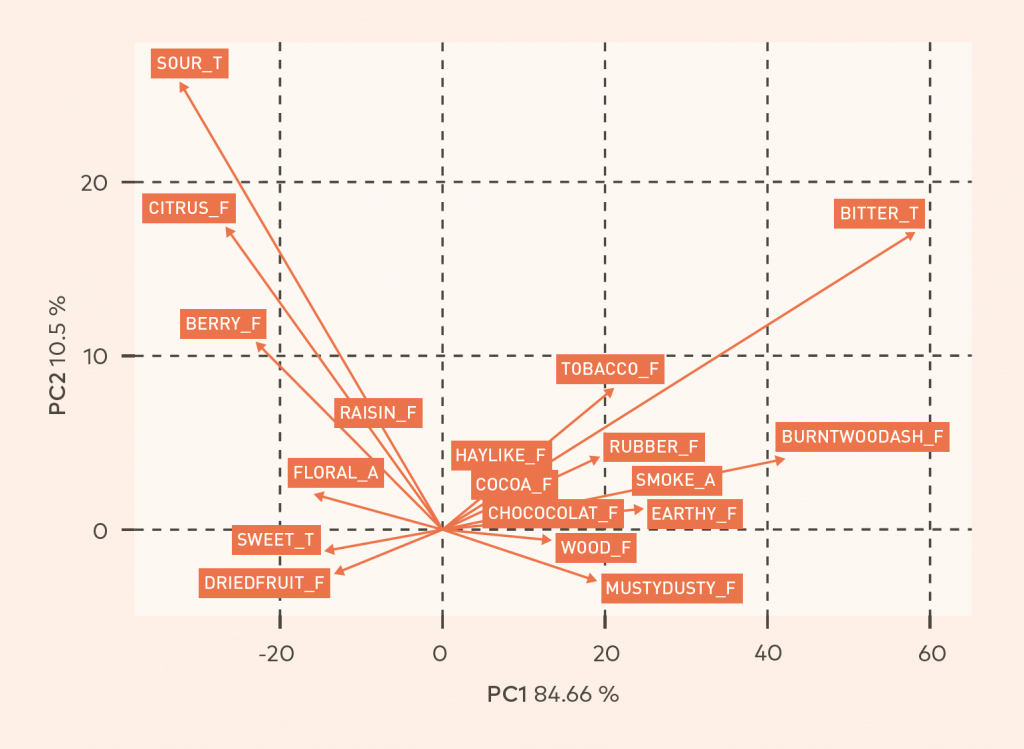
Fig. 2: The bottom plot outlines the flavor attributes of each grouping. Use the top plot as a map for the bottom: the cone of light-roasted coffee yielded notes of sour, citrus, and berry; the basket, notes of raisin, dried fruit, and sweet florals.
There are several take-home messages from the PCA plots. First, and unsurprisingly, there is a large difference between the light and dark roast, as evidenced by the large horizontal separation in the roasts. More interestingly, we see that for a given roast (e.g., the light roast at left), the basket shape also yielded a meaningful difference. The flat-bottom basket yielded flavor attributes with more dried fruit, sweet, and floral flavor intensities, while the conical basket yielded more citrus, berry, and sour. Similarly, the basket shape affected the dark roast, with the flat bottom yielding more pronounced chocolate, cocoa, and woody flavors, and the conical yielding much more intense bitterness.
Which is Best?
That’s a key point, so let’s reiterate it: using exactly the same coffee, same water, same temperature, and same flowrate, we were able to change the flavor profile of the brewed coffee in a very perceptible and statistically significant manner simply by changing the geometry of the filter basket.
Having demonstrated that there is a difference, and what the difference is, the final question is “Why is there a difference?” The basket geometry affects the manner in which the liquid flows through the bed of coffee grounds, and thus alters the “mass transfer” process by which molecules move out of the solid coffee grounds and into the liquid. The underlying details of this process are complicated; the UC Davis Coffee Center is actively investigating this, and many other aspects of coffee brewing, in great depth.
For now, though, you might want to know: Which basket shape is “best?” The answer, of course, is that whatever brew method tastes the best to you is “best,” and it’s up to each individual to decide. At the very least, though, the next time somebody starts debating the merits of flat-bottom vs. conical filter baskets, you can use the hard data in this article to shed some light on the debate.
Professors WILLIAM D. RISTENPART and JEAN-XAVIER GUINARD are co-directors of the University of California Davis Coffee Center, where Dr. SCOTT FROST recently completed a postdoctoral fellowship.
Deep dive into drip: Professor Ristenpart, Dr. Scott Frost, and Mackenzie Batali will give lectures on three different facets of this research collaboration at the Specialty Coffee Expo in Boston (April 11–14). View the full schedule at coffeeexpo.org.
Special Thanks to Our Issue 8 Sponsor, Bellwether
Bellwether makes more than a first-of-its-kind, zero-emissions, commercial roaster. They make it possible for you to source, create, roast, and share coffee in a responsible way that connects our community and brings equality to our industry. Learn more at bellwethercoffee.com.
Are you an SCA Member? Claim your complimentary subscription to the print version of 25 Magazine in English at sca.coffee/signmeup.
Not a member? Join now and support the mission of our non-profit trade association at sca.coffee/join.